
Finding the products that were quietly losing money
Analysed 12 months of revenue, cost and expense data across every product line, and moved product sales 76% by fixing the pricing on the ones that looked profitable and weren't.
Power BIExcelDAX
Analysed 12 months of revenue, cost and expense data across every product line, and moved product sales 76% by fixing the pricing on the ones that looked profitable and weren't.
Segmented 72,000 customers across 272 stores to identify who drives category revenue, then measured whether a store trial actually worked.
Public retail transaction dataset, 255,510 rows across 272 stores. Independent analysis.
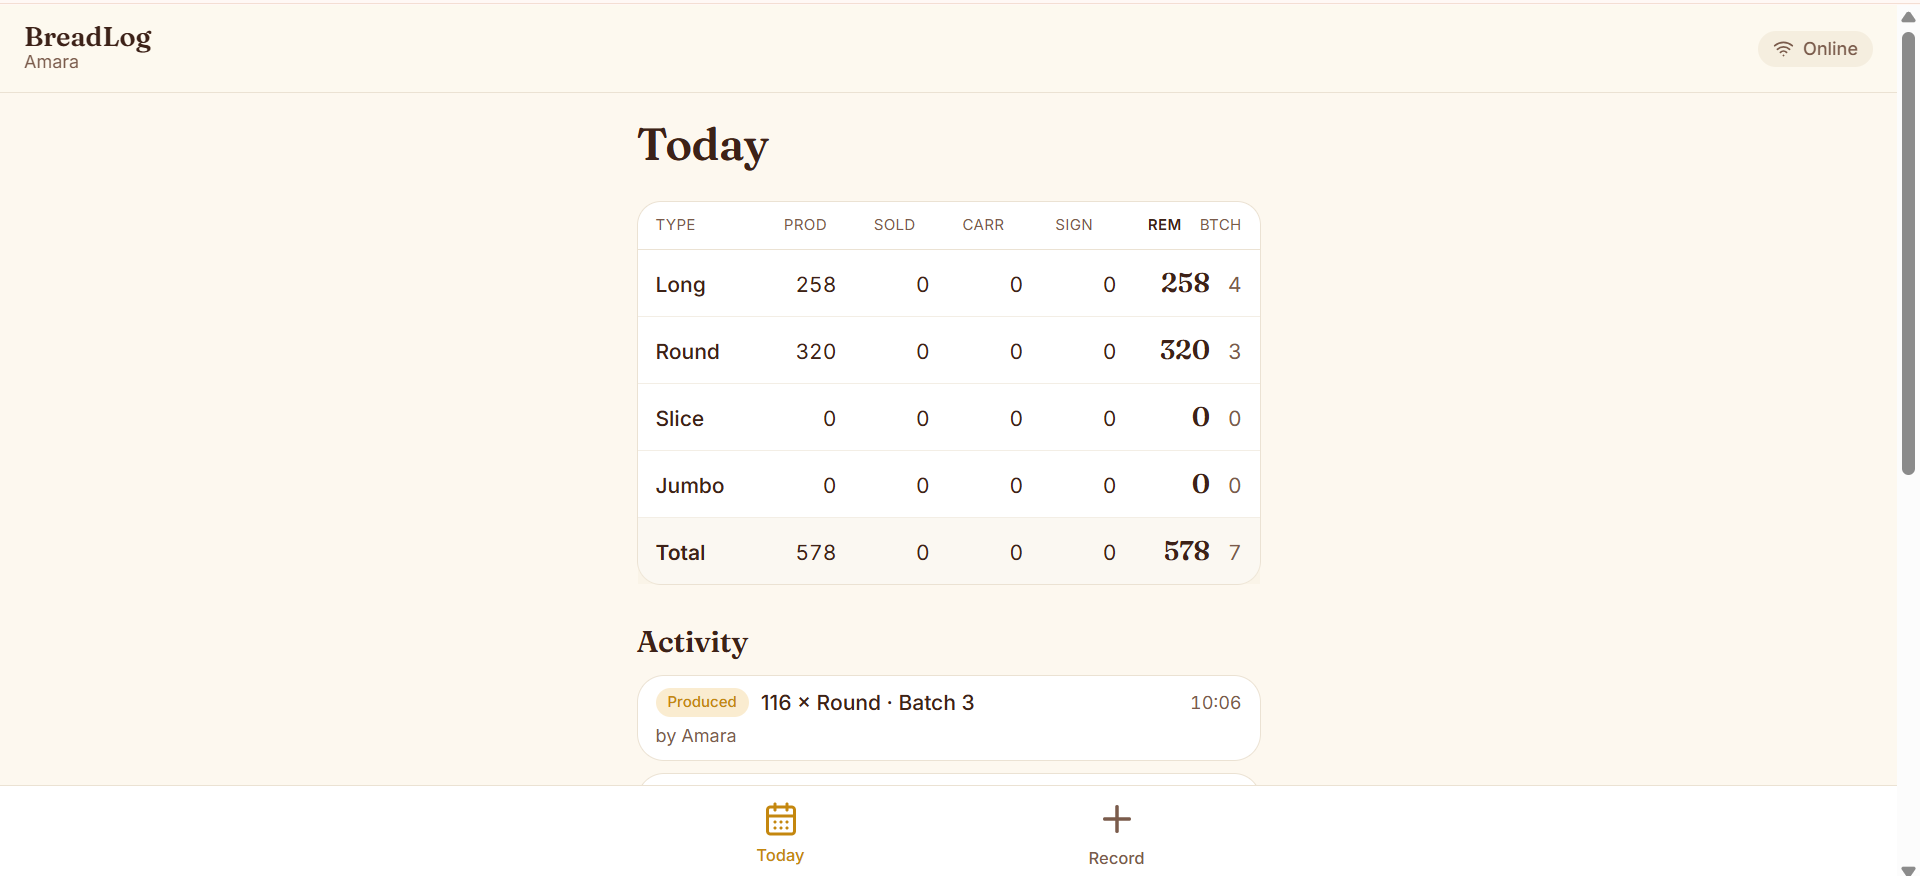
Replaced manual daily stock and production logging with an automated pipeline. Weekly reporting fell from several hours to under 30 minutes.
A five-phase investigation into water access inequality across a fictional African nation of 27 million people.
Which factors most influence recovery time, and what a ward can act on. In progress; built on synthetic records, no patient data.
Mapped intake, fitting and delivery stages to find where patients wait longest. Identified a 34-day average gap between measurement and device readiness.